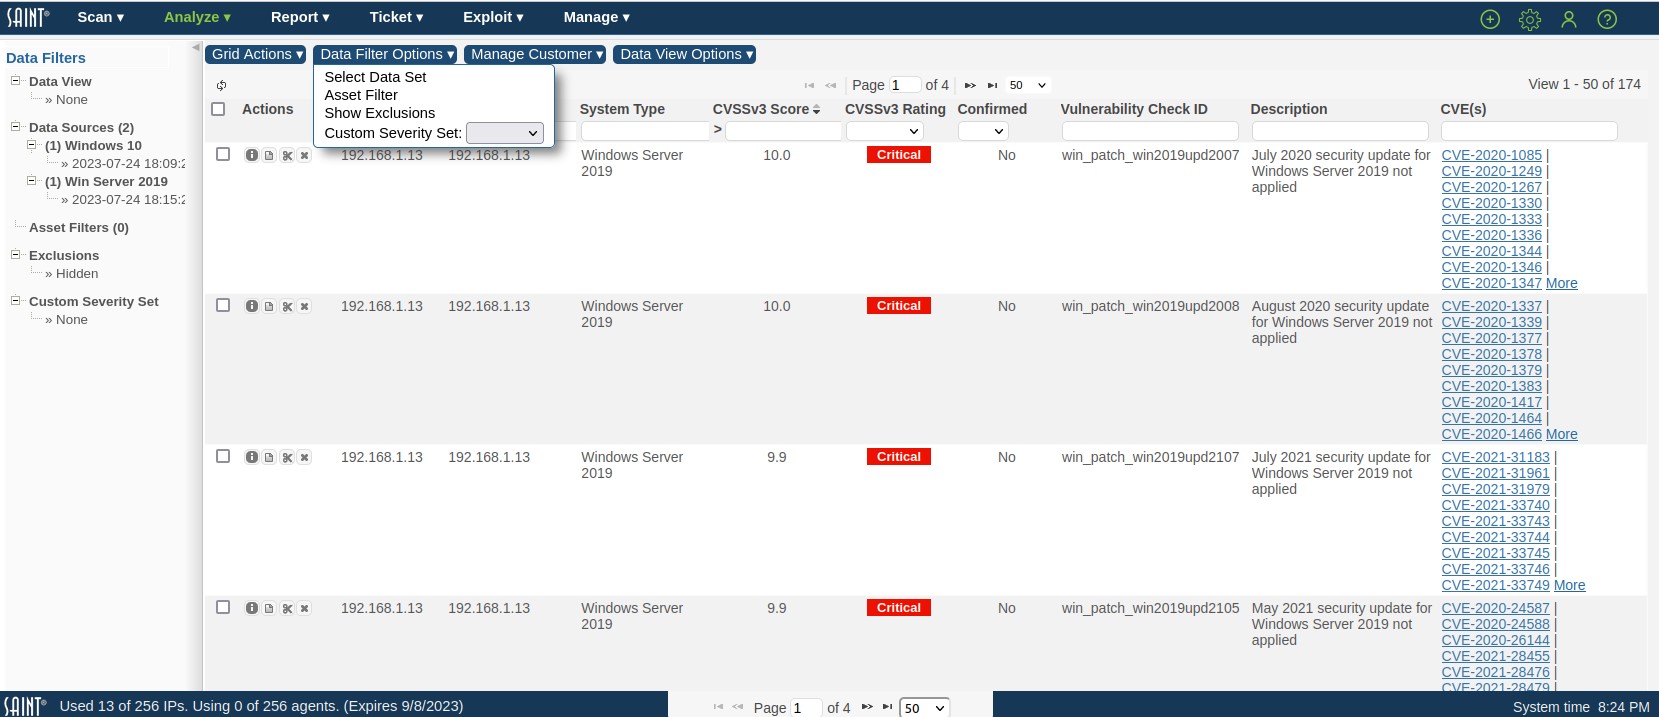
Data Filter Options
Many of the features in the user interface (Dashboards; Analyze; Reports; Configuration; reporting) provide a Data Filter Options feature to allow the user to select the data context for display such as selecting the scan data by Job(s) and/or selected Scan(s); constraining the data by selected Asset Tags or Custom Severity Sets; and showing or hiding results that have been flagged as an Exclusion. The following example shows data filter options for analyzing detailed scan results.
Note that the data filters you set will be kept in memory and retained as you navigate throughout the product. For example, if you set the Exclusion filter on a page in the Analyze tab to “Show,” then results you see in Dashboards will reflect all results for the selected data sets, including those that have been flagged as Exclusions. If you are constraining results by Asset Tag “OS” = “Windows”, then the results will be limited to hosts that have an Asset Tag “OS” equal “Windows”.
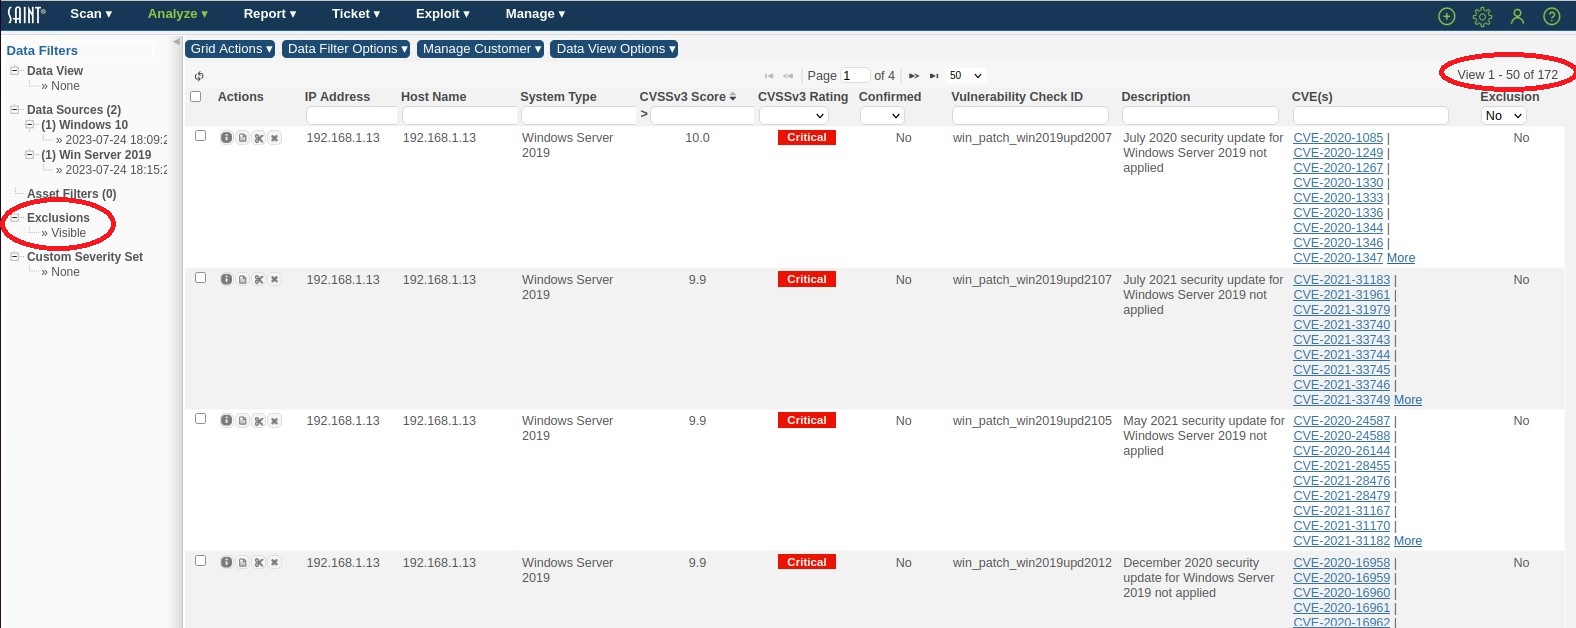
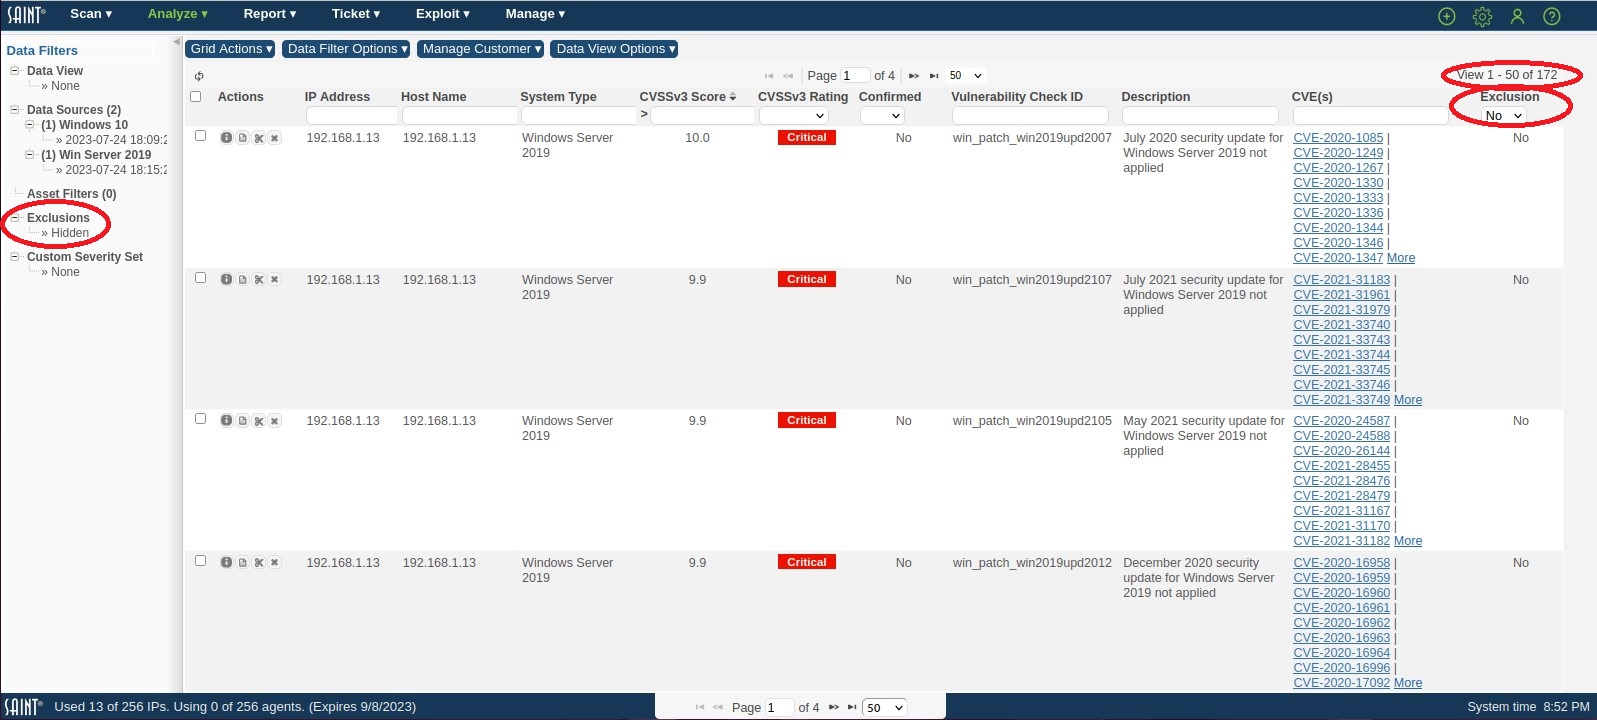
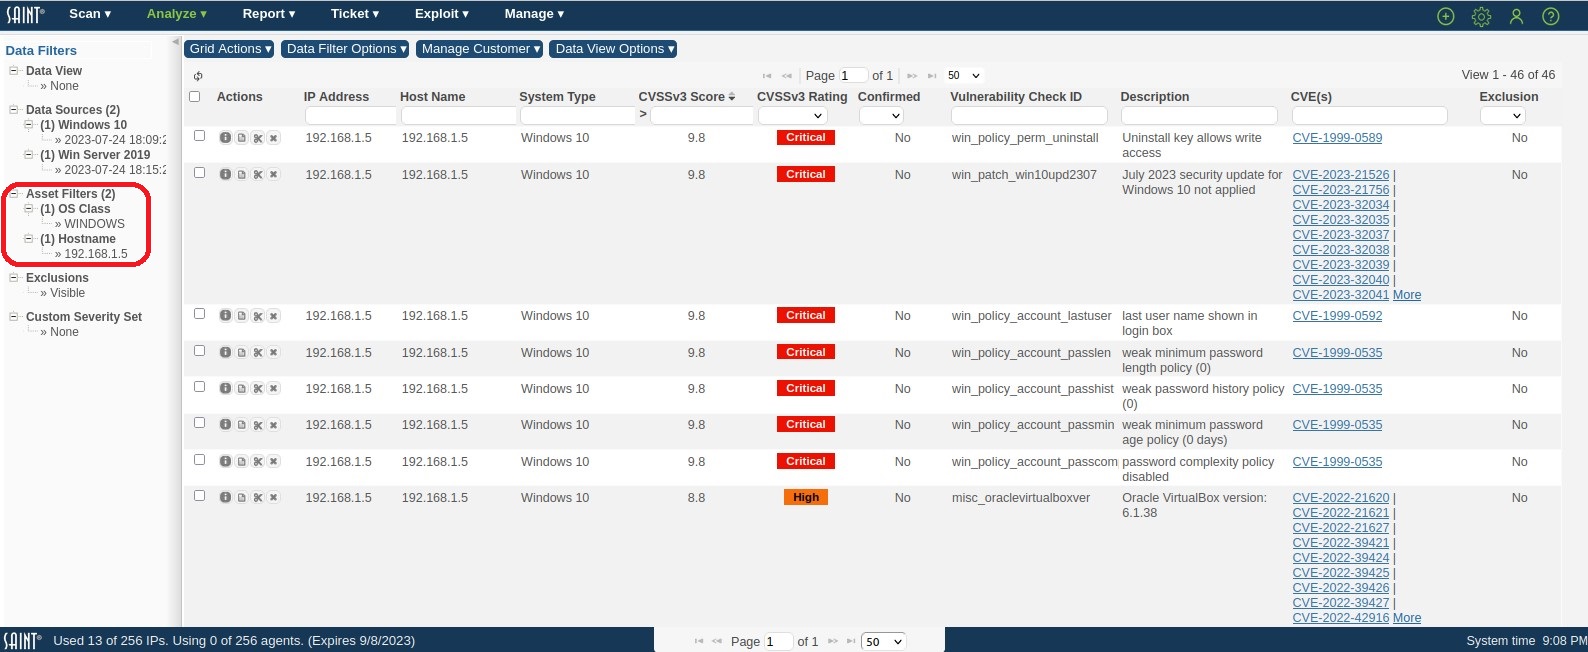
Data Filters Context Panel
As shown in the example above, any page that displays scan results will also provide the capability to display the current data “context” defined by the selected data filters. In the example above, the current data is based on three scans conducted for can Job Subnet 10.8.0, with no Asset Tag filters or Custom Severity Sets, but does hide scan results previously flagged as an Exclusion.
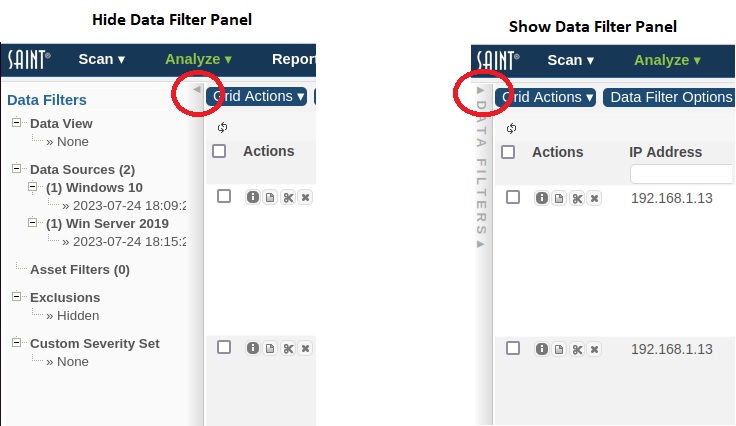
The Data Filters panel can be controlled to show (for data context) or hide (to conserve screen space) it by clicking on the left arrow in the upper right corner of the panel.
Select Data Set
The Select Data Set option enables you to select one or more scan results (scans) produced by previously executed scan jobs, and set these data sets as the context across the application. As shown below, Job column values can be selected by the user, to include associated values such as Target Group, Scan Policy, User Group or User (job owner). Clicking on a job displays the list of scans executed for the job, to include the date/time the scan was completed; job title, and the number of vulnerabilities found during the scan. You may choose one or more jobs to merge entire collections of scan results into a single result for analysis. Or, you may select one, multiple, or all scans executed within a single job to view scan results.
The selector also provides the capability to set the number of scans to retrieve to support trend analysis. In the Scans panel, you can enter one (1) in the “__ most recent scans” option to always use the most current scan run data for the selected job(s); or enter a number greater than one if you want to use more than one scan result for a selected job to support trend analysis.
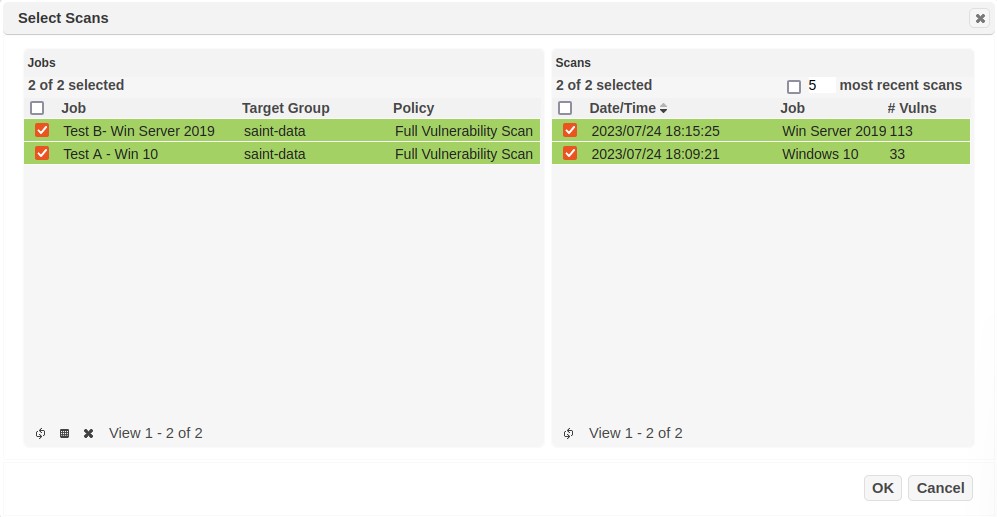
Note that you are not restricted on the type of results you can select for analysis. This means that you can select multiple types of scans (e.g., full vulnerability scan; an XCCDF configuration policy scan; and a Pen Test policy scan), and produce a single output in both the Dashboard and Analyze grids. This can be beneficial in displaying raw output, but note that results may not be useful in computing particular types of dashboards more directed at vulnerability counts, or other risk-specific areas.
Understanding the Content Counts
The following is an example of a user view choosing all jobs in the job selector to gain visibility of all scans executed for those jobs. The grid counts describe jobs and scan results as follows:
Jobs:
View x – x of x – These grid counts mean there are 15 total jobs in the current display, and 15 total jobs in the system. Currently, this grid is not designed to “page” rows by a limited row count per page, so all jobs are available for sorting and use within the single page.
Scans:
View x – x of x – These grid counts mean that there are 14 total scans completed or being executed (ready; queued; in progress), and 13 are visible and available for selection for analysis. The one indicates that the user has selected a single scan result for display.
In a more practical example, a user has selected to view all completed scans run for two recent Jobs that used the PCI scan policy. Two scans were completed. The user chooses to select the first job for analysis.
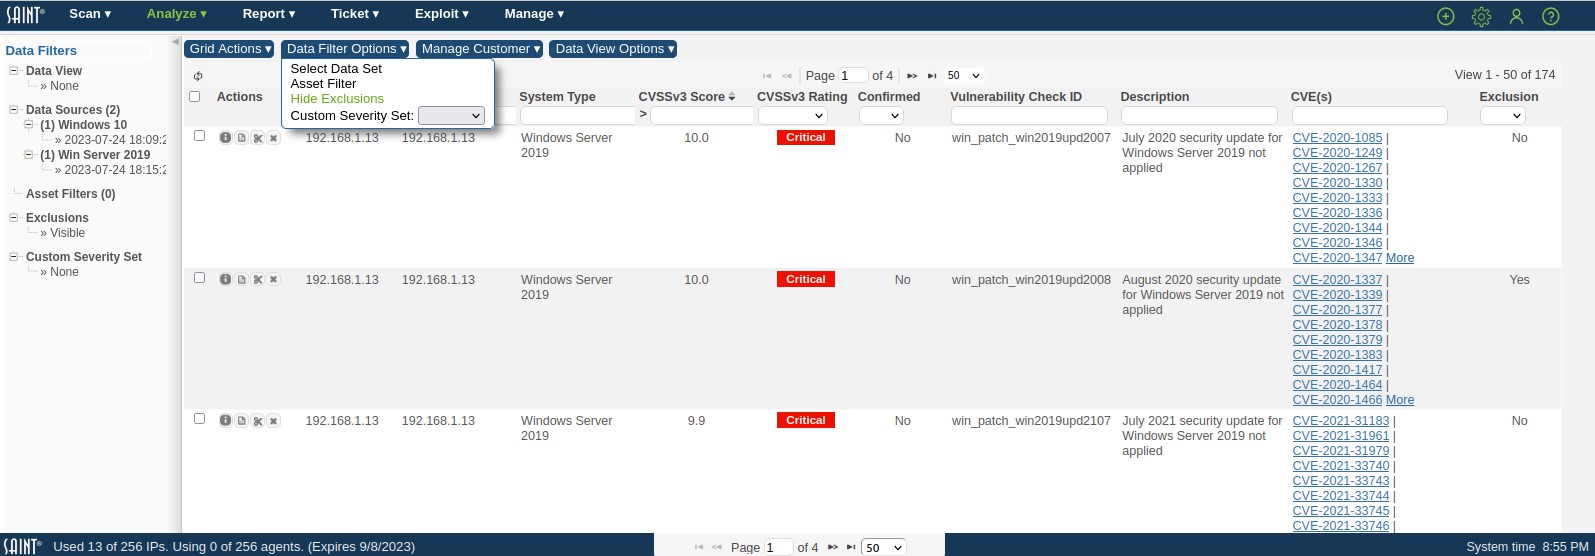
Hide/Show Exclusions
The Hide/Show Exclusion option in the Data Filter Options provides the capability to show results in dashboards and analysis based on all scanned results (Show Exclusions) or filtered to show and compute results based on results that do not have a Vulnerability that is currently flagged as an Exclusions (Hide Exclusions). Click the applicable option in the Data Filter Options dropdown to toggle the results for "what if" analysis based on vulnerabilities that have or have not been flagged as exclusions.
The following screen shots show a series of data results to illustrate this feature: 1) showing all scan results; 2) filtering the records in the Exclusions column to "Yes" to show only records with the Exclusion flag; 3) removing the Exclusion constraint at the Column level and using the Data Filter option to Hide only records set as an Exclusion; and 4) all results but filtered in the data's Exclusions column to see the records that have the Exclusion flag set to "Yes". Note the total record count at the top right of the data grid, as this flag is filtered. See the Exclusions section for more information about how to set exclusions on vulnerabilities.

Asset Filter
This option in the Data Filter dropdown provides the capability to filter the results in the analyze and dashboard grid and Report content based on Asset Tags. Click this option to view the Asset Filter dialog, as shown below:
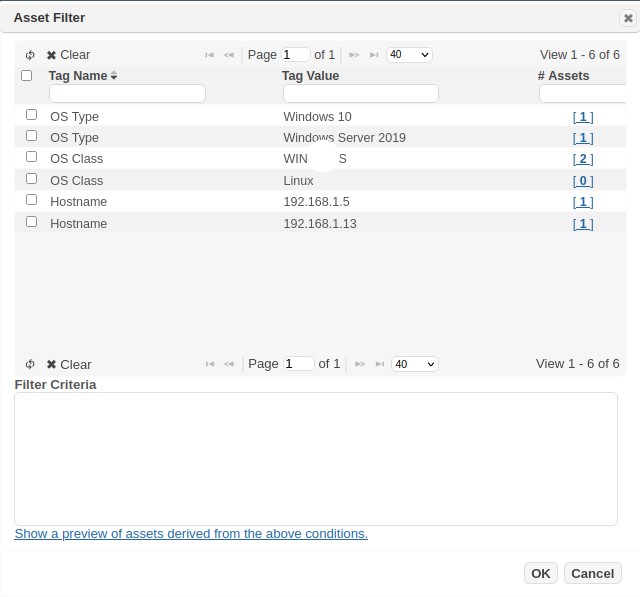
To filter the content:
-
Select a Tag Name for the tag(s) to be displayed (e.g., Criticality)
-
Click on the tag value. Use control-click to select multiple options, as in the example below, to see results for both Criticality High and Medium.
-
Click the Add button to add the filter to the Filter Criteria box
-
Repeat steps 1-3 to add additional Tag criteria.
In this example, we will filter the scan results to location=Dallas and assets that have been tagged as Criticality High or Medium:
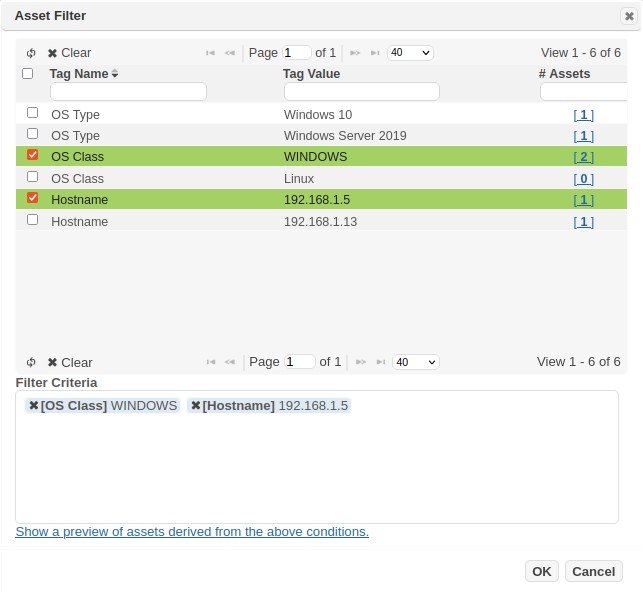
Click OK to save the filter criteria.
Close the Asset Filter dialog to view the results constrained by the chosen filter(s).
Risk Filter
This option in the Data Filter dropdown provides the capability to filter the results in the analyze and dashboard grid and report content based on risk level and the asset’s risk factors. Click this option to view the Risk Filter dialog, as shown below:
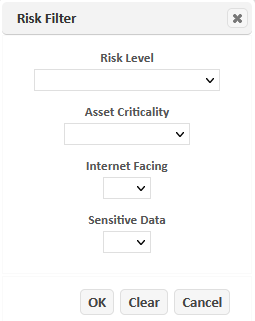
To filter the content, use the drop-down menus to select the risk level, asset criticality, whether the asset is Internet facing, and/or whether the asset has sensitive data. Then click OK. The content will then include only the results which match the selected risk level and asset risk factors. The selections will remain in your user context until they are cleared using the Clear button or by setting each option to blank.
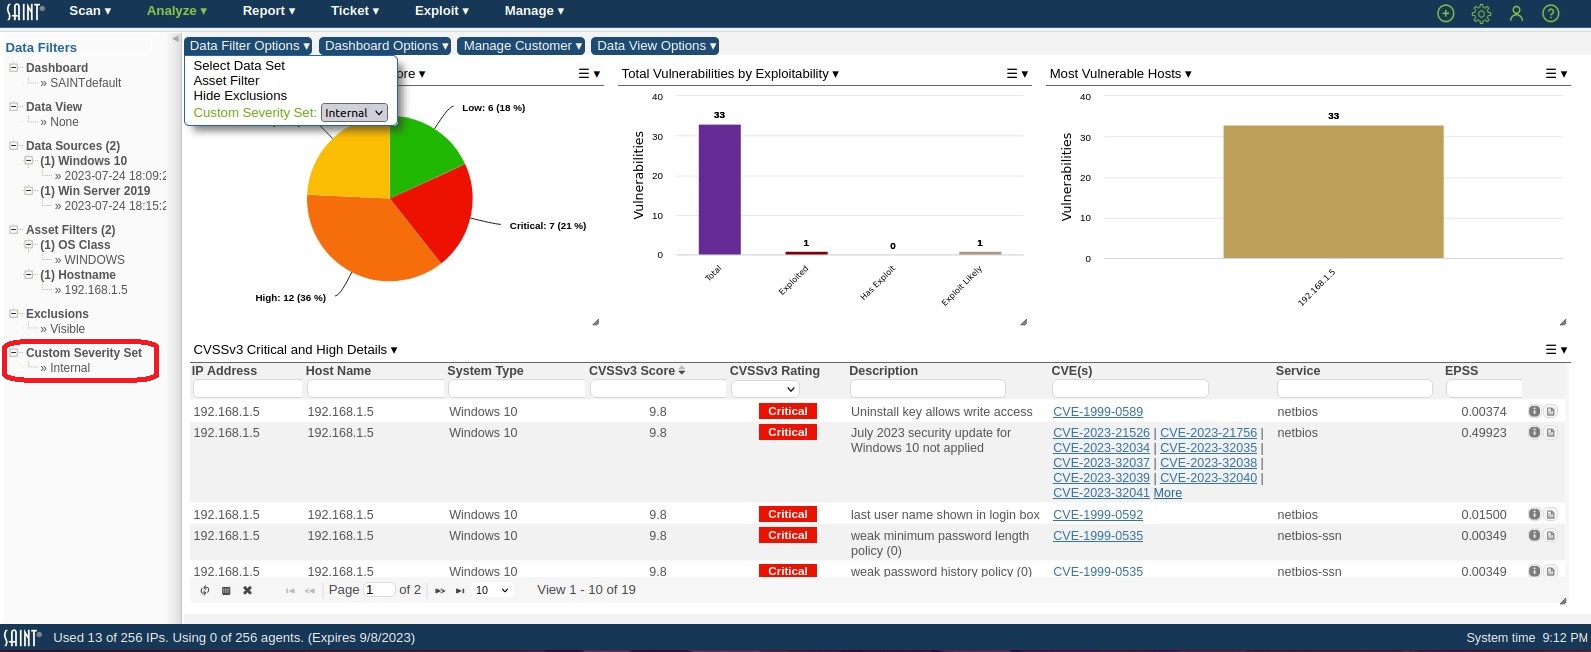
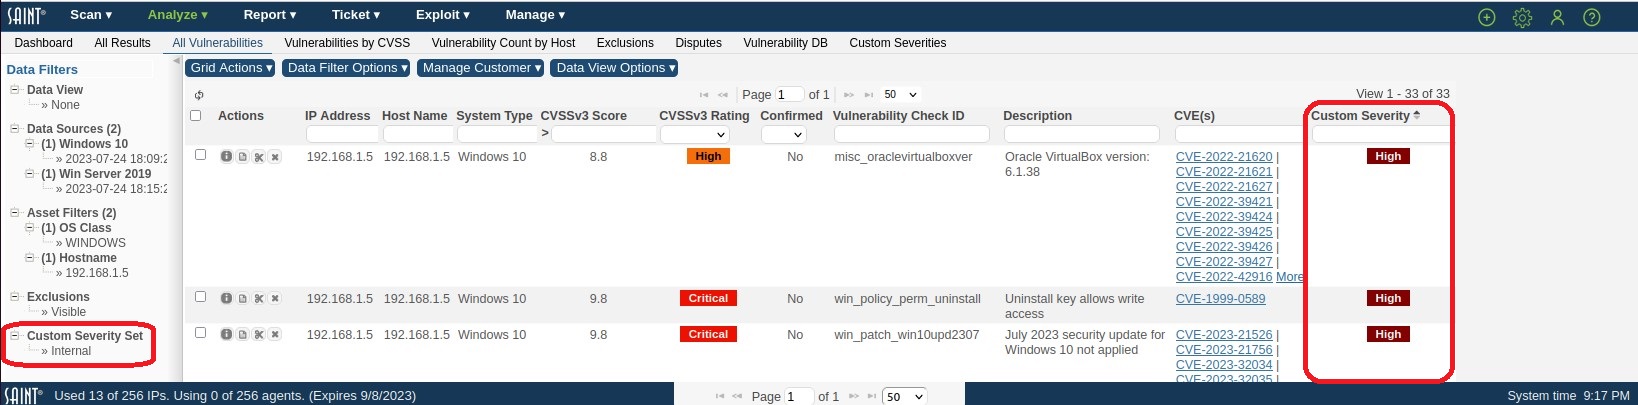
Custom Severities Set
The Custom Severity Set filter option provides the capability to display and compute vulnerability results based on the severities defined locally, rather than by external sources such as SAINT's Severity categories or NIST's CVSS scores. The Custom Severity Set drop-down menu option is available from any page used to display or compute scan results. For example, in the following screen shots, Severity codes of Severe, High, Medium, Low and Acceptable have been previously defined as the "Internal Severity Standards" using the Custom Severities management page found under the Analyze tab. The Dashboard displays computed results, data drill-down and charts based on the vulnerabilities associated with the selected Severity Set. The Analysis tab then provides a more detailed view, displaying the custom severity codes for individual vulnerabilities that are associated with: